ax.set_title() 和 plt.title(),以及 df,plot(title='') 区别
plt.XX 之类的是函数式绘图,通过将数据参数传入 plt 类的静态方法中并调用方法,从而绘图。fig,ax=plt.subplots() 是对象式编程,这里 plt.subplots() 是返回一个元组,包含了 figure 对象(控制总体图形大小)和 axes 对象(控制绘图,坐标之类的)。进行对象式绘图,首先是要通过 plt.subplots() 将 figure 类和 axes 类实例化也就是代码中的 fig, ax,然后通过 fig 调整整体图片大小,通过 ax 绘制图形,设置坐标,函数式绘图最大的好处就是直观,但如果绘制稍微复杂的图像,或者过子图操作,就不如对象式绘图了,ax.set_title() 是给 ax 这个子图设置标题,当子图存在多个的时候,可以通过 ax 设置不同的标题,如果仅仅是调用 plt.title() 给多个子图上标题,就比较麻烦了。
ax.set_title()
import  matplotlib .pyplot as plt
x=[1,2,3,4,5]
y=[3,6,7,9,2]
# 实例化两个子图(1,2)表示1行2列
fig,ax=plt.subplots(1,2)
ax[0].plot(x,y,label='trend')
ax[1].plot(x,y,color='cyan')
ax[0].set_title('title 1')
ax[1].set_title('title 2')
plt.title()
import  matplotlib .pyplot as plt
x=[1,2,3,4,5]
y=[3,6,7,9,2]
# fig,ax=plt.subplots(1,2)
plt.figure(1)
plt.subplot(121)# 12表示子图分布:一行2列;最后一个1表示第1个子图,从左往右
plt.plot(x,y,label='trend')
plt.title('title 1',fontsize=12,color='r') #r: red
plt.subplot(122)#第二个子图
plt.plot(x,y,c='cyan')
plt.title('title 2')
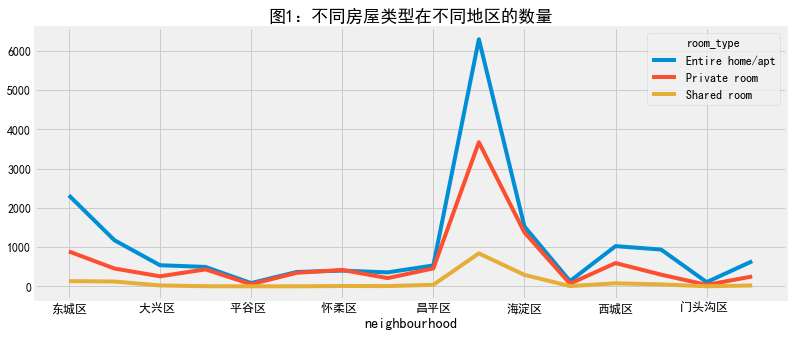
pandas 的 df 自带的 plot,自带设置图片大小,图片命名等。
#按照neighbourhood和room_type分组,计算每个值的个数和price的均值
neigh_roomtype=listings.groupby(['neighbourhood','room_type']).agg({'id':'size','price':'mean'})
#将ID改为number
neigh_roomtype=neigh_roomtype.rename(columns={'id':'number'})

#先对number计算统计可视化等
number_n_r=neigh_roomtype.unstack()['number']
number_n_r.plot(figsize=(12,5),title='图1:不同房屋类型在不同地区的数量')

